| Graphics on the ARM | |
| Roger Amos |
What are graphics?
In computer jargon the term graphics generally denotes any images that appear on the monitor screen or in printouts with the exception of text using the computer's or the printer's resident typefaces. So pictures, lines and other shapes are all graphics while normal text is not.
That, however, is misleading. The word graphics comes from the Greek word which means I write. Strictly, then, graphics should embrace text and, indeed, the visual aspect of the entire content of the monitor display or printout. A graphic designer, after all, is responsible for the overall appearance of pages in books. magazines and newspapers; his province includes the text as well as rules, tables and illustrations.
Similarly in the Acorn RISC-based computers the distinction between text and graphics is not always clear. The RISC OS 3 operating system includes the outline font families Corpus. Homerton and Trinity in ROM; they are permanently resident in the machine's memory and many applications display text in these attractive typefaces instead of the rather uninteresting 'system' font. Moreover, the characters in these fonts are stored as outline drawings (vector graphics); most printers print them as graphics and some software accesses them as graphics rather than as text allowing them to be manipulated in exactly the same way as other vector graphics. The distinction between text and graphics is tenuous.
This book. is concerned principally with graphics in the more generally accepted sense: images such as pictures and line diagrams. But there will be plenty of references to text where this is relevant to the understanding of graphics.
Mathematical and abstract graphics (described in Chapter 15) form a third system.
Types of graphics
There are two principle systems of computer graphics; vector (or line) graphics and pixel (or bitmap) graphics. These two systems are represented in RISC OS applications by Draw and Paint respectively. The differences between them are a consequence pertly of the two quite independent ways in which the screen is organised in Acorn computers and partly of the form in which the graphics are stored.
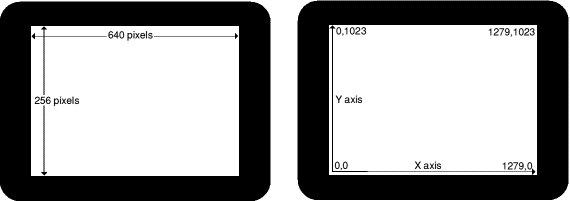
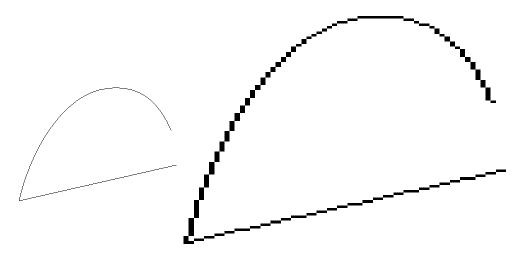
Figure 1.1 illustrates a monitor display in stylised form. Graphics (and text) are confined to an active area which occupies all of the screen except for the border. The active part of the screen consists of an array of tiny rectangular dots called picture elements or pixels, each of which contains a single colour. Everything that appears on the screen, text or graphics, is visible only because the colours of its pixels have been made different from those of the surroundings. Because the monitor display consists entirely of rectangular pixels, inevitably most graphics are a matter of compromise. Indeed, the only items that the screen can reproduce with strict accuracy are straight lines or rectangles which are perfectly vertical or perfectly horizontal and whose dimensions correspond to an exact number of pixels. Oblique lines, if closely examined, will always appear jagged, since they are inevitably composed of a series of miniature zigzags in which each element is horizontal or vertical; this is most noticeable when the line is only slightly off the horizontal or vertical. Similarly, curves can never be perfectly represented in a rectangular matrix of pixels. Rug and tapestry makers face a very similar problem! Clearly the smaller the pixels used -that is to say, the higher the resolution - the less obvious these shortcomings will appear. The same, of course, applies to printouts. Those produced on a dot matrix printer at 144 dots per inch will inevitably look more crude than those produced on a laser printer at 300 dpi, while at 600 dpi curves appear smooth and gradual, even under a magnifying glass. See Figure 1.2.
The number of columns of pixels across the screen, the number of rows of pixels down the screen, the shape and size of the pixels and the maximum number of different colours that may be displayed simultaneously on the screen are all a function of the screen mode. RISC OS incorporates a wide range of screen modes (47 of them in RISC OS 3) which cater for most requirements and the range can be further extended using software. For the present we shall confine our considerations to 12 of the most commonly used modes which are integral to RISC OS. Modes 0. 8 l2 and 15 are all 640 pixels wide and 256 pixels deep; they allow 2, 4, 16 and 256 colours respectively. In these modes the pixels are oblong, their height being double their width; consequently graphics in these modes have a horizontal resolution that is twice as sharp as the vertical resolution. Modes 18, 19, 20 and 21 are also 640 pixels wide and again offer 2, 4, 16 and 256 colours respectively. They are, however, 512 pixels deep and their pixels are square, giving equally fine resolution along both axes. To use these modes you must have a multisync monitor. If you have the monitor supplied with the A5000 machine, you will probably most often use modes 25 to 28 which are similar to modes 18 to 21, but only 480 pixels deep; the pixels are square and the display occupies nearly the full width of the monitor screen. This contrasts with the other modes which leave a substantial border either side of the active display area.
Since the number of rows and columns of pixels on the screen vary depending on the screen mode in use, these do not provide a consistent medium for specifying the sizes or locations of graphics on the screen. For example, an image that was defined as 20 pixels high and located 100 pixels from the bottom of the screen would double its height and move up the screen if you changed from mode 20 to mode 12.
For this reason RISC OS offers an alternative convention which measures and positions graphics on the screen with greater consistency. This convention maps the screen using a co-ordinate system calibrated in OS units. By default the origin is the bottom left hand corner of the screen, although it can be repositioned, with the ORIGIN statement in BASIC, for example. Most screen modes are 1280 OS units wide and 1024 deep, so the top right hand corner of the screen is at 1279,1023. The VGA modes (25 to 28), however, are slightly smaller at 1280 x 960. So graphics created in, say mode 20 may be too tall to fit on a VGA screen, as owners upgrading to the A5000 machine soon discover! Some other modes cover a larger graphics area; mode 31, for instance, is 1600 x 1200 OS units. In this book, for simplicity. we shall assume all screens are 1280 x 1024 OS units unless otherwise stated.
Any point on the screen (or even outside its perimeter but in the same plane) can be specified by its x (horizontal) and y (vertical) axis coordinates. You. may be familiar with basic's DRAW and PLOT facilities which place graphics on the screen using this system.
Since in the muitisync modes 18 to 21 the active area of the screen measures 1280 x 1024 OS units and the screen consists of 640 x 512 pixels, it follows that the OS units are exactly half the width and height of the pixels. Perhaps future Acorn machines supporting even higher resolution graphics will offer screen modes having 1280 x 1024 pixels in which the pixels and graphics co-ordinates will correspond exactly,
Vector graphics
In vector graphic the image on the monitor screen or in the printout consists of lines and filled shapes which the computer has plotted from the co-ordinate data. Since the screen's co-ordinate system, as we have seen, is largely independent of screen mode, vector graphics are also independent of screen mode or printer resolution
The artwork in vector graphics consists of one or more 'objects' each made up of one or more lines. The lines in an object may form closed paths such as rectangles or circles: areas enclosed by lines may be assigned their own fill colour. Since each object is effectively an independent drawing which can moved, deleted or edited usually without affecting other objects in the artwork, vector graphics packages are sometimes termed 'object-based' packages. Most object-based drawing packages can handle other kinds of object besides vector graphics
As you compose the first object in your drawing, the computer stores a block of data describing it in a reserved area of memory called the data stack. As you create further objects in your artwork, the computer adds blocks of data describing them above the existing stack con tents. Consequently the sequence of the blocks of data that build up in the stack initially follows the order in which the objects were created. However, both the data in the blocks and the sequence of the blocks in the stack may be edited subsequently, as we shall see.
This data stack is the very core of vector graphics and other object-based applications, including desktop publishing (DTP). It is this stack that is saved when you store your artwork on disc, and whenever the application needs to redraw the picture, e.g. after editing, after reloading work or clearing some other window that temporarily obscured your artwork, the computer reads through the data in the stack and from them redraws your picture, object by object.
The presence of the stack confers some remarkable properties on object-based graphics. Consider what happens, for instance, when redrawing two objects which overlap, the one that comes lower (earlier) in the stack is drawn in the normal way, but soon afterwards the other object is also drawn, partially overwriting the first one. So, in the screen display or printout, the object whose definition comes later in the stack will appear to stand in front of the earlier one. The stack then determines the order of the objects from back to front and this provides what is almost a third dimension in the artwork.
For instance, if you use vector graphics to create a conventional picture of, say, a countryside scene, it is simplest to draw the background first, and then items in the middle distance and finally items in the foreground. The last item drawn will be at the top of the stack and therefore will appear to stand in front of all other objects on the screen or in the printout. However, you need not feel constrained by this. Most packages provide facilities to edit the sequence of the data blocks in the stack. In Draw these facilities are somewhat, rudimentary, allowing you only to send an object (or group of objects) to the front (i.e. the top of the stack) or to the back (i.e. the bottom of the stack). With careful repeated use, however, these facilities allow you to rearrange the objects in the artwork in any order from front to back. Many other packages such as DrawPlus and Vector also allow you to step any object backwards and forwards through the stack until it is at the required 'height'.
Although objects created later may overwrite earlier ones, they do not. destroy them. Even if an object is completely hidden - for example, if you draw the sun and then draw a cloud which. completely obscures it (see Figure 1.3) - the data that describes the hidden sun is still present in the stack, so, if you subsequently move either object or if you delete the offending cloud, the sun will reappear.

Another fascinating consequence of the modus operandi of vector graphics packages is the comparative ease with which you can correct any part of your drawing with which you are dissatisfied. If you draw a line and then find it is the wrong thickness, the wrong length, the wrong colour, or simply in the wrong place, you can very easily amend it or even delete it and start again. You needn't worry about whatever detail was behind it, the software will take care of that automatically as it redraws its way through the data stack. This is, of course, a boon to the artist with limited talent, or to the perfectionist!
Moreover, it opens the field of computer graphics to people who are deprived of other means of creative visual expression. A friend of mine who is a very gifted engineer lost almost all use of his hands in a tragic accident. Subsequently he has been unable to use a pen or any conventional drawing implements. He cannot use a mouse, but when his company purchased Corel Draw (which has a similar specification to ArtWorks) to help in the creation of promotional documentation he found that he could control the software quite satisfactorily using a trackerball with foot switches duplicating the three buttons. Today this means of turning his ideas to hard copy is making a significant contribution to his company's work on the very frontiers of technology. At a less sophisticated level, similar hardware and graphics software gave hitherto unimaginable creative opportunities to people suffering many kinds of handicap.
Ironically some criticise vector graphics for generally lacking detail, while others point out that, in contrast with pixel graphics where the detail is of necessity limited by the pixel size, vector graphics offer infinite detail. Both sides are only partly correct. In vector graphics you can have as much detail as you wish, but adding copious minute detail is extremely tedious. Consequently vector graphics often use simple fill colours causing them to resemble drawings or cartoons rather than paintings or photographs. More sophisticated packages such as ArtWorks, however, provide graded colour fills, making possible very realistic representations of three dimensional objects. Chameleon 2 adds this facility to Draw and similar packages while the grade facilities in Vector and the RISC OS 3 version of Draw also provide this kind of effect.
However, vector graphics do not offer infinite detail; nothing in this world is infinite. In vector graphics the resolution is determined by the units in which the application stores its co-ordinate data; in Draw that unit is 1/46,080 inch. The reason for this rather strange figure is given in the next chapter. Obviously to make full use of such a fine resolution you must either work at a far higher magnification than the regular zoom facility allows or enter your co-ordinate data in numeric format. It may appear as though infinite detail is possible, though, as you can magnify part of a vector graphics drawing by as much as a thousand times without the limitations of resolution becoming obvious. This stands in marked contrast with pixel graphics which are intended for display at one particular size and whose pixel structure is disturbingly obvious at magnification factors as low as four, (Contrast Figure 1.4 with Figure 1.6,)
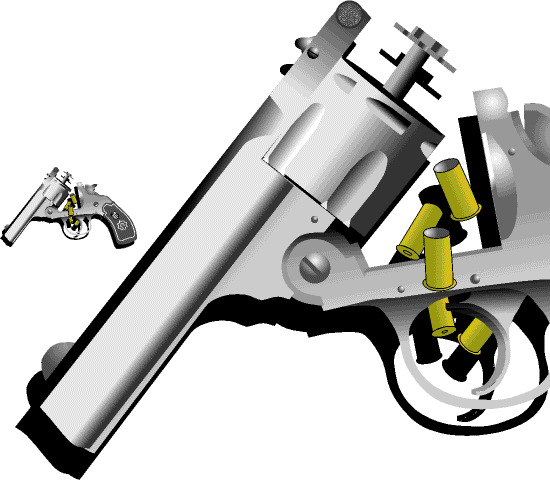
Indeed the ease with which vector graphics can be magnified is another of its strengths. To make your drawing (or part of it) n times its present size it is only necessary tor the computer to find the relevant, co-ordinates and line thicknesses in the data stack and to multiply them by n (see Figure 1.5), a very simple task for a computer.
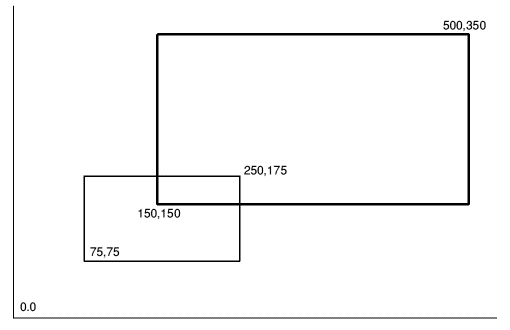
When the new values are in place, the artwork is redrawn at its new size. Of course, if n is less than 1, your graphics are made smaller. (This flexibility is the raison d'Ítre for outline font systems; one set of character outlines will provide all possible font sizes.) Moreover, you can apply separate magnification factors to the x and y axes, allowing your graphics to be stretched or squashed. If n is made negative, the image is flipped about the axis or axes concerned. Indeed magnification provides one useful technique for handling all those fiddly details too small to handle at even the highest zoom setting: magnify the object by a really substantial factor, say 100, allowing you to work on it with room to breathe, and when you have finished magnify it by 0.01 to restore it to its proper size. If you ever need to hide a drawing, try magnifying it by 0.001. It can then be concealed conveniently behind a full stop in some text, recalling classical espionage techniques. Magnifying it by 1000 will restore it to its original condition, although any text present may now be incorrectly sized.
There is, of course, a penalty to pay for all these fascinating features and that penalty is in time. Vector graphics, by definition, must be plotted on the screen line by line and even for the ARM that takes appreciable time, especially if curves are involved. For example, an an ARM2 fitted machine in mode 20 Draw takes exactly 10 seconds to plot one of my drawings consisting of 38 kilobytes of pure vector graphics. An ARM3 reduces the time to about 2 seconds. To use such complex vector graphics as the basis of a fast-action arcade game would clearly be totally impractical.
Pixel graphics
Pixel graphics consist of two dimensional arrays of pixels,. Normally these pixels correspond to the pixels which make up the monitor display, although they need not always do so.
These two dimensional arrays of pixels are commonly called sprites. Sometimes a sprite is as entire screen, but it can be any size, larger or smaller than a screen. When you save your artwork, the file created simply represents the colours in the sprite, pixel by pixel, together with some other vital data such as the sprite's dimensions, the screen mode in which it is intended for display and sometimes information about the colours used. The data in the file are of course sufficient to reproduce the image but generally contain no details whatever concerning the stages by which the image was created.
This leads immediately to one significant contrast with vector graphics. In pixel graphics if you overlay part of your image with new matter, the overwritten material is lost irretrievably - unless you have a copy of it saved somewhere else. Similarly, if you erase some detail that you decide is unwanted, you may find then find you have an unsightly gap in the background which needs to be filled.
Pixel graphics packages include routines for creating lines and shapes in a variety of colours, just as vector graphics packages do. But they also contain a diversity of facilities which have no counterpart in vector graphics packages. These are routines concerned with individual pixels rather than large areas of the screen. Examples are pixel editors, which allow you to change individual pixels, and 'spraygun' facilities which allow you to change pseudo-random groups of pixels in a given area to a chosen colour.
This facility to address individual pixels meant that the pure colours offered by the system palette could be supplemented by additional effects using 'dither patterns', ie. alternating the colours of adjacent pixels in a chequerboard pattern, long before this facility became available in vector graphics packages on the ARM machines. In high-resolution graphics modes individual pixels are barely visible, and on the screen a dither pattern will give a convincing impression of an intermediate colour. By combining dither patterns and spraygun effects you can produce subtle gradations of shading, allowing the creation of pictures with 'photographic' realism.
Detail is of course limited to the size of the pixels. Each piece of pixel artwork is ideally intended for display in one particular screen pixel, although RISC OS contains sophisticated routines that allow sprites to be displayed in 'foreign' screen modes - even those which use pixels of different shapes or sizes - while retaining their original proportions. As mentioned earlier, using a zoom facility to magnify the image does not reveal additional detail, it simply makes the pixel structure of the graphics all the more obvious, as Figure 1.6 shows.
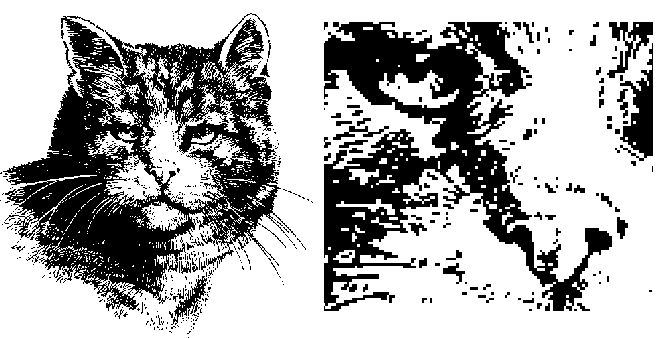
However, when displayed in its intended mode, especially if this is a high-definition mode such as mode 12 or mode 15, the level of detail in a sprite is quite acceptable; indeed the picture quality is similar to that of a standard TV or video picture. And since this level of detail can be created with comparative ease, most of the more artistic graphics software packages use pixel graphics techniques.
Another advantage of pixel graphics is speed. RISC OS includes a comprehensive library of routines for handling and manipulating sprites and these are easily accessible to the user. They work so fast that even BASIC applications on an ARM2 machine can throw a succession of sprites on the screen fast enough to provide smooth, life-like animation.
Applications of graphics -an overview
Each of the two graphics systems has its strengths and its weaknesses. These are summarised in Table 1.1. Not surprisingly, the fundamental differences between them have led to their finding divergent uses.
| Vector graphics | Pixel graphics | |
| Speed of plotting | slow | fast |
| Ease of adding detail | poor | good |
| Ease of editing | excellent | poor |
| Resolution | almost unlimited | limited by pixel size |
| Applications | DTP, graphic design, engineering drawings and schematics, 3D drawings, originals for animation | computer art, fast arcade-style games, animation |
Vector graphics are ideal for all applications which demand accuracy and unlimited restrictions on editing. engineering and architectural drawings, electronic circuit diagrams and process plant schematics can all be produced to very high accuracy and can be edited easily whenever the design is amended.
Because vector graphics can build up images from separate overlapping components they are suitable for many applications. Most of the vector graphics programs tor the ARM machines are educational but some are used for design in industry and commerce. The smArt 'linked graphics system' from 4Mation is an example. Schoolchildren can experiment with a car that can he given various body styles (sports coupe, hatchback or saloon), various door styles and wheel trims; a fashion collection allows potential fashion designers to dress mannequins in garments and wigs offering almost limitless permutations of style and colour, and a heraldry collection allows crests to be built up from a wide choice of heraldic motifs.
All serious desktop publishing (DTP) packages use the same object-based philosophy, even if their graphics facilities are limited to displaying and printing rather than creating or editing graphics. It is not hard to see why. The introduction of a new object, such as a picture, over the top of an area of text must not cause the text to be lost; the text must be preserved and, normally, reformatted so that it flows around the newly introduced object. This is achieved using the typical object-based technique of keeping a copy of the text (in ASCII format) in the data stack.
A multiplicity of graphic design packages, ranging from the comparatively simple FontFX to the sophisticated Fontasy, import characters from the outline font system as vector graphics. They can then perform an almost unlimited variety of fascinating manipulations and transformations on the graphic objects. The ability to take any object (each character is an object) or any group of objects and move it, rotate it, squash it or expand it (and then put it back as it was if not satisfied) is all grist to the mill for graphic designers.
Vector graphics can be created from mathematical models. This is the basis of so-called three-dimensional drawing packages such as Euclid. These generate drawings of three dimensional objects such as houses, cars or items of furniture as viewed from any angle, distance and elevation specified by the user.
Although it was suggested earlier that vector graphics are too slow for use in animations, they do nevertheless have many roles in the creation of animations. Since the artist can move objects around, concealing and revealing other objects in the background, vector graphics provide a highly versatile computer equivalent of the paper cut-out animation system. Although vector graphics are used to generate the original images that will be strung together as an animation, those originals are usually converted to sprites lo facilitate their rapid handling. This is analogous to photographing the frames set up with paper cut-outs.
There are, however, some animation systems which use vector graphics in real time, although the subjects depicted must of necessity be kept simple. These are interactive animations of which the most. obvious examples are flight simulators (Figure 1.9). In these the size and viewpoint of the roads, fields and buildings visible from the cockpit depend entirely on the location, altitude and orientation of the simulated aircraft and this is of course under the user's control! The subjects are stored as mathematical models and their images are generated in real lime as vector graphics. The level of detail of these graphic's in some applications depends on the processing power available; an ARM3 can draw more in a given time than an ARM2 can.
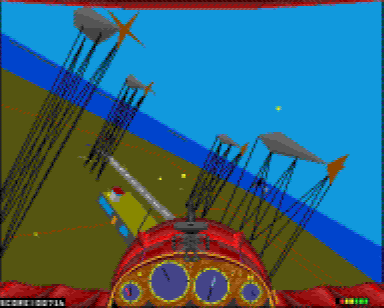
'Virtual reality', which has attracted much attention in the media, uses the same principles; it is a 'simulated world' which the operator views generally using a personal stereoscopic display. This senses movements of his head, giving the user the impression that he has entered the virtual world. It has serious uses, for example an architect can take a client on a simulated tour of a proposed building before it has left the drawing board and psychologists are researching its use in diagnosing and treating such disorders as schizophrenia. It also has leisure uses in highly sophisticated computer games, especially fantasy adventures, often employing several players. Domark's 3D Construction Kit describes itself as a virtual-reality system for the ARM machines, although it uses the regular monitor and interfaces rather than a stereoscopic viewer.
Since pixel graphics offer fine and direct control of detail with a resolution of one pixel, they are the basis of many computer art packages Many of those for the ARM machines are restricted to mode 15 which offers a palette of 256 colours with effectively thousands more colours available as dither patterns. Stunningly lifelike pictures can be built up by patient users having an artistic bent; reproductions of the old masters sometimes even hint at the texture of the oil paint with which the original was created!
The artwork used in most fast-action arcade games uses exactly the same principles. The level of detail available is staggering, the picture quality being similar to that obtainable from a video cassette recorder. Indeed, some recent games include scenes that were actually filmed using a video camera and converted to graphics using a video digitiser. Material from photographs can also be converted to pixel graphics using a scanner and much image enhancement software is available which can sharpen pixel graphics giving more realistic displays both on screen and in printouts.
The use of mathematical models was mentioned in connection with three dimensional vector graphics and interactive animations. They also find applications in pixel graphics. Given a mathematical model of a scene including details of the light source present, suitable software can recreate the image that would be captured by a camera at a known location. This technique is known as ray tracing since it effectively examines the rays arriving at the viewing point and traces them back to to each light source, taking into account reflections from the various surfaces in the scene. The process is time-consuming but does result in stunningly beautiful pixel graphics of imaginary objects.
Animation involves throwing a series of pictures onto the screen in rapid succession. The need for both speed and detail dictates that most animation is pixel-graphics based, 'This leads to the problem of storage space. Smooth, lifelike animation demands at least 12.5 frames per second. If your animation uses whole mode 15 screens, you will be able to store only four such frames on an 800K disc, giving an animated sequence lasting less than a third of a second! However, by a combination of such techniques as file compression, the use of less demanding screen modes and the repeated use of small sprites it is possible to build up interesting animated sequences lasting several minutes which will still fit on an 800K disc. These techniques will be described later.
Conversion between graphics types
To convert vector graphics to pixel graphics is simple. The computer performs this conversion every time it sends vector graphics to the screen or to the printer (unless it is a PostScript printer). To convert a vector graphics image (or part of it) to a sprite, you simply set the required screen mode, put the graphics on the screen and then 'grab' the appropriate part of screen memory. The 'Get screen area' or 'Snapshot' facility in Paint is ideal for this.
Conversion in the opposite direction - from pixel graphics to vector graphics - is rather more problematic. You might be excused for thinking it is totally impossible, but there are software packages that perform this conversion, albeit with limitations. Generally known, understandably enough, as 'tracing packages', they work by detecting the edges of the coloured areas in the sprite and constructing best-fit approximation outlines which are then translated into vector graphics data format. Many sprites - especially those containing an abundance of pixel-sized detail - are unsuitable for this conversion. The best results are from sprites containing simple blocks of pure colour. The items depicted in the image are converted on an 'as seen' basis and not necessarily as you or I would convert them. Thus in a picture of the sun rising over the horizon the sun is usually interpreted as an orange semi-circle and not as a full circle half concealed below the horizon. Moreover the order of the resulting objects in the stack might not necessarily reflect the spatial relationships of the subjects depicted, although most packages do succeed in achieving a fairly sensible order. These packages are considered in more detail in Chapter 12.


