
|
www.riscos.com Technical Support: |
This chapter describes the desktop debugging tool (DDT). DDT is an interactive aid to debugging desktop or non-desktop programs written in compiled languages such as C, Pascal or Fortran. DDT can also be used to debug programs written in ARM assembler using ObjAsm. It can be used on any of the Archimedes range of computers running RISC OS 2.00 or later.
Although DDT can be used to debug desktop programs, and provides a windowed interface, it is not a true multitasking desktop program. This is because DDT has to be able to halt the RISC OS desktop at any point for single stepping, breakpoints etc. This means that its interaction with other RISC OS applications is limited in certain ways:
Note: You can always tell when the debugger is active, because the pointer will change to a No Entry sign if you move it outside the debugger's windows:

The windowed interface of DDT is designed to be easily understood by RISC OS desktop users, and to facilitate this it duplicates many RISC OS features. However, it uses visual details such as unusual colours to act as reminders that it is not operating as a true desktop multitasking program.
This section is aimed mainly at readers who haven't used a program debugger of any sort before. However, others may find it useful reading, as it introduces some of the facilities provided by DDT.
Anyone who has written a program more than about ten lines long has had recourse to debugging techniques: the tracking down and removal of errors. The form this takes depends on many things, not least the language in which the program is written.
Some languages provide primitive debugging facilities of their own. For example ANSI C provides the assert macro which can be used to ensure a condition is true, as in the following example:
assert(i >= 0); /* Ensure following loop is finite */
while (i--) { ... }
Some language implementations provide additional debugging facilities. A description of the debugging facilities provided by Acorn's release of ANSI C may be found in the accompanying Acorn C/C++ manual.
Often, however, it is left to the programmer to plant trace information in the program itself. For example you might trace the value of the index variable in a while loop as follows:
while (i--) { fprintf(tracefile, "i = %d\n"); ... }
Such additions to the program can be useful, but are tedious to use in compiled languages, because every time you want to change the debugging statements, the program has to be recompiled. There is also the possibility that the debugging statements themselves have undesirable side-effects which contribute to the ill-health of the program.
Planting trace information in assembly language programs is more difficult. For example, displaying the contents of all ARM registers is a non-trivial code fragment in ARM assembler.
A debugger enables you to execute your program in a controlled environment where you can stop execution, examine and alter variables, set breakpoints, single step through a program and 'watch' particular variables for changes.
DDT provides the following debugging facilities:
This section describes how to prepare your program for use with DDT. DDT uses special information in the program being debugged, which provides DDT with information about the source code that generated the program. This information is not automatically included in the output of the compiler. This is mainly for reasons of efficiency: programs which contain debugging information are larger, take longer to compile, and run more slowly than those with no debugging information.
You enable the generation of debugging information with the Debug option on the compiler SetUp menu. If you are using the compiler from the command line use the -g flag to enable debugging information with the Acorn ANSI C compiler (other compilers may use different flags, though -g is common across a wide range of compilers.
Because each module of a program can be compiled with its own debugging information, you need only specify debugging for suspect modules. Well-proven modules in which you have complete faith can be compiled with no debugging information, whereas newer, less reliable code can have debugging information enabled.
Turning on debugging inhibits optimisation, and reduces the speed of execution of your program even when you are not debugging it. This of course does not matter when you are using the debugger, but for maximum speed, programs should be compiled without debugging information, especially for production builds.
Note that if you are using an automated program construction tool, such as the Make utility, you may have to delete the object files of the modules you wish to compile with debugging information when you enable the Debug option. This is because the modules are not recompiled until the object files are either absent, or out of date with respect to the source files, so you must delete the object files to force recompilation.
When linking a program to be debugged, you must instruct the linker to include the debugging information generated by the compiler. To do this, enable the Debug option on the link menu, or, if you are using the linker from the command line, by using the -debug flag.
If you are using Acorn's ANSI C compiler to perform the link stage (i.e. without the Compile only option enabled on the compiler menu, or without the -c flag from the command line) the compiler will automatically instruct the linker to include debugging information if the compiler's debugging option is enabled.
The linker also generates its own debugging information. This debugging information is used by DDT to provide low-level or symbolic debugging facilities. If you do not wish to use source level debugging facilities, you can enable the Debug option on the linker without enabling the Debug option on the compiler.
Note that !RunImage files compiled or assembled and then linked with Debug enabled are much larger than those produced without debug information. This may require an increase in the WimpSlot size specified in your !Run file, otherwise the following error may be produced at run time:
No writable memory at this address
If you are writing in assembler using ObjAsm you may wish to use the KEEP directive, which instructs the assembler to keep information about local symbols in the symbol table. These will be included in the program when linked with debugging enabled.
You might like to try preparing the following small program for use with the debugger, using the methods described above.
   1 #include <stdio.h>
   2
   3 int main(void)
   4 {
   5     int world;
   6
   7     for (world = 0; world < 100; world++)
   8         printf("Hello, World %d\n", world);
   9     return 0;
  10 }
You can start a debugging session in one of the following ways:
*DebugAIF program [arguments]
where program is the name of the program to be debugged, and arguments are any command line arguments that program may take. You can enter this command from the supervisor prompt (outside the desktop), from the Shell CLI prompt (obtained by choosing the *Commands option on the Task Manager menu) or from a task window CLI prompt.
Try invoking the debugger on the sample program shown at the end of the last section.
Once you have started a debugging session in one of the above ways, two debugger windows will be displayed as follows:
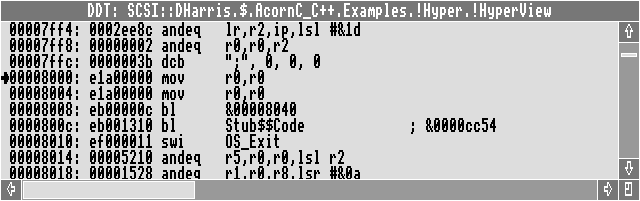
The upper window is the Context window. The title bar contains the name of the program being debugged. The Context window displays the source text or symbolic disassembly associated with the current Context or PC location.
When you start a debugging session, the Context window initially displays a symbolic disassembly, like that shown above. This is a disassembly of the run-time system initialisation code. The arrow symbol ( ) to the left of the window shows the current PC location. The debugger does not display your source code at this stage because the program has not started executing your code, it still has to execute the initialisation code. Once execution reaches your code (i.e. the first instruction of main) your source code will be displayed.
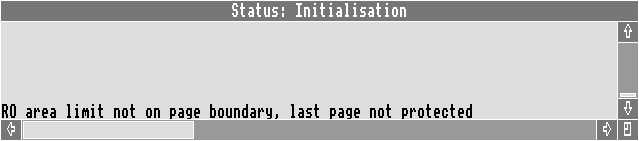
The lower window is the Status window. The title bar contains the current status of the program being debugged. The Status window displays error and informational messages, in addition to any data displayed by the debugger's display, trace and watchpoint facilities. The Status display scrolls when any new information is displayed. You can use the scroll bar to examine earlier contents of the status display.
Some messages that may appear in the Status window at this stage are:
No debugging information available
This means that you are debugging a program which has not been linked with debugging information. No source-level or symbolic debugging facilities are available, and debugging is limited to machine-level debugging (i.e. everything must be specified in terms of machine addresses). If you have forgotten to link the program with debugging information you should quit the debugging session, relink the program with debugging enabled and start the debugging session again.
No source level debugging information
This means that you are debugging a program which has been compiled without debugging enabled. No source-level debugging facilities are available, symbolic debugging facilities are available (i.e. objects can be specified in terms of link time symbols). If you have forgotten to compile the program with debugging information, quit the debugging session and recompile the program with debugging enabled.
RO area limit not on page boundary, last page not protected
This message occurs when memory protection is enabled (as it is by default) and the last part of the code or read only area is not page aligned. This means that the last page of the read only area cannot be protected against accidental writes, since writing to data, or a read/write area which immediately follows the code area, would cause an erroneous data abort. You can ignore this message. Future versions of the linker may align the areas on page boundaries when linking with debugging enabled.
Can't set breakpoint on procedure main
When a debugging session is started the debugger automatically tries to set a breakpoint on main if the Stop at entry option is enabled (as it is by default). If the address of main cannot be determined, because, for example, the module containing the procedure main has not been compiled with debugging information enabled, or, the program is not written in C, then the above message will be displayed.
Try moving the pointer completely outside the debugger's windows. The pointer will change to a No Entry pointer, indicating that the debugger is active and you cannot select anything outside the debugger's windows. Moving the pointer back inside the debugger's windows changes it back to the usual arrow pointer.
Clicking Menu on either debugger window produces the following menu:
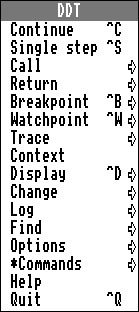
Continue, Single step, Call, Return, Breakpoint and Watchpoint are explained in the section Execution control.
Trace, Context, Display and Change are explained in the section Program examination and modification.
Log, Find, Options, Help, Quit and *Commands are explained in the section Options and other commands.
Once the debugger is running, the program can be executed, single stepped, have its variables examined or altered and so on. All of these facilities are described in the following sections. However, before you can use these facilities, you must know how to refer to certain program objects. Variable names, line numbers, procedure names and memory addresses all have a syntax which must be used if you are to reference the desired object.
The following notation will be used in describing the syntax:
For example, an optional, comma-separated list of numbers would be denoted by:
[number{,number}]
Procedure names are used, for example, when setting a breakpoint on entry to a procedure. The syntax for a procedure name is:
[module:]{procedure:}procedure
where module is the name of a program module and procedure is a procedure name within that module. Each procedure name in the list of procedure names refers to a successive procedure in the textual nesting of procedures. The module name is the leaf filename of the compiled source file. For example, consider the following program fragment stored in file pas.test.
 program raytrace(input, output);
 var count : integer; ...
   procedure pixel(x, y : integer);
   var colour : integer; ...
   function reflect(x, y : integer; angle : real) : integer;
   ...
   begin (* body of reflect *) end;
   begin (* body of pixel *) end;
 begin (* body of raytrace *) end;
The full name for function reflect would be:
test:raytrace:pixel:reflect
that is, procedure reflect contained in procedure pixel contained in procedure raytrace (the debugger treats the entire Pascal program as one large procedure) contained in module test (module names do not generally make much sense for Pascal, since standard Pascal has no facilities for separate compilation, but many Pascal implementations, including Acorn's ISO Pascal, have extensions to allow separate compilation).
Note: Some Pascal implementations on Acorn computers do not represent procedure names in the manner described above. Instead, they generate a new procedure name at the outermost level by concatenating enclosing procedure names to the current procedure name separated by a dot. Also, they do not generate a pseudo-procedure for the whole program. Thus, with such an implementation, the full name for function reflect would be test:pixel.reflect.
You do not need to type the full name every time you wish to refer to a procedure: Since the prefixed module name and procedure names are optional they can be omitted, and the procedure referred to by its name alone (e.g. reflect or pixel.reflect in the above example). Sometimes it will be necessary to enter a longer version of the procedure if there are two or more procedures with the same name.
Suppose in the above example there was a procedure:
test:raytrace:line:reflect
reflect on its own would be ambiguous, so you would have to enter pixel:reflect or line:reflect to specify which one you meant. Note that it is still not necessary to enter the test:raytrace prefix, since the line or pixel prefixes are sufficient to render the procedure name unambiguous.
Similarly, suppose you had two C modules called quickdraw and slowdraw, each containing a static function circle. In this case you would need to enter either quickdraw:circle or slowdraw:circle to indicate which circle function you were referring to.
Even if two procedures have the same name, it may not be necessary to enter more than the procedure name on its own. When looking at a procedure specification, the debugger searches back along the dynamic call chain (i.e. the chain of procedures called to reach this point in the program) to find a procedure name which matches the first name in the procedure specification. Having found this, it matches the rest of the procedure specification against textually nested procedures contained within the first procedure found.
For instance, in the above example with two reflect procedures, if the program was stopped (at a breakpoint, perhaps) at some point in pixel:reflect, then reflect on its own would refer to pixel:reflect, since on looking at the dynamic call chain the debugger would find that it was in a procedure called reflect, and would match that against the procedure specification reflect.
Variable names are used, for example, when setting a watchpoint. The syntax for a variable name is.
[procedure-specification:][line number:]variable
where procedure-specification is a procedure specification as described in the section above, line number is a line number in a source file and variable is the name of a variable.
As in the case of a procedure specification, the debugger tries its best to match a variable name given to it, by first searching back along the dynamic call chain, and then searching the global variables, so it is usually not necessary to specify more than the variable name on its own.
In the raytrace example above, if the program was stopped at some point in the function reflect then x, y and angle would refer to the arguments in function reflect, colour on its own would refer to the local variable colour in procedure pixel (since the debugger searches back the call chain and finds procedure pixel containing a variable colour). The variable count would refer to the global variable count in program raytrace.
In some cases, however, it may be necessary to specify more information about the variable; suppose, for example, you wanted to examine the arguments x and y to the procedure pixel. Specifying x or y on its own would display the x or y argument in function reflect so you must specify pixel:x or pixel:y.
There may still be some ambiguity in languages other than Pascal. In Pascal you cannot declare local variables within a program block (i.e. between a begin...end pair), however C allows declarations in local blocks. Consider for example the following code fragment as it would be displayed in the debugger's source window:
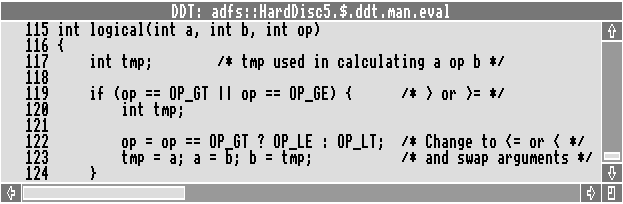
The are two declarations of tmp in logical, so tmp or logical:tmp may be ambiguous. In this case you must specify a line number before the variable name to remove the ambiguity.
For example, to refer to the tmp variable in the outer scope (i.e. at the function level) you could enter:
117:tmp
or
logical:117:tmp
To refer to the tmp variable in the inner block, use:
120:tmp
or
logical:120:tmp
The line number should be the line number of the declaration of the variable (in this case 117 or 120). The line numbers are displayed in the source window, so it is quite easy to find the line number of the declaration.
The syntax described above is sufficient to refer to all textually nested variables. However, variables in earlier instances of a recursive or mutually recursive procedure cannot be accessed. For example:
void hanoi(int src, int dest, int via, int n)
{
  if (n > 1) {
    hanoi(src, via, dest, n - 1);
    hanoi(src, dest, via, 1);
    hanoi(via, dest, src, n - 1);
  } else
    printf("Move disc from peg %d to peg %d\n", src, dest);
}
Suppose this function is called with n = 3 and that it recurses until it hits a breakpoint on the printf when n = 1. There is no direct way to refer to the variables src, dest and via in an outer call when n = 2 or 3 since any reference to these variables will refer to the variables in the call with n = 1. What you can do is, use the Context option on the debugger's main menu (described in the Program examination and modification) to change the context to an outer call on the stack. Since the debugger searches from the current context outwards, you can now specify the variable as per normal. The debugger will ignore the variables in inner calls and use the variable in the current context.
Several DDT commands (for example Display Expression) may take arbitrary expressions. The syntax for these expressions is based on that found in C.
The following table summarises the operators available along with the precedence of each operator.
| 1 | () | grouping, e.g. a*(b+c) |
| [ ] | subscript, e.g. isprime[n], matrix[1][2] | |
| . | record selection, e.g. rec.field, a.b.c | |
| -> | indirect selection, e.g. rec->next is (*rec).next | |
| 2 | ! | logical not, e.g. !finished |
| ~ | bitwise not, e.g. ~mask | |
| - | negation, e.g. -a | |
| * | indirection, e.g. *ptr | |
| & | address, e.g. &var | |
| 3 | * | multiplication, e.g. a*b |
| / | division, e.g. c/d | |
| % | remainder, e.g. a%b is a-b*(a/b) | |
| 4 | + | addition, e.g. a+1 |
| - | subtraction, e.g. b-d | |
| 5 | >> | right shift, e.g. k>>2 |
| << | left shift, e.g. 2<<n | |
| 6 | < | less than, e.g. a<b |
| > | greater than, e.g. n>10 | |
| <= | less than or equal to, e.g. c<=d | |
| >= | greater than or equal to, e.g. k>=5 | |
| 7 | != | not equal to, e.g. count!=limit |
| 8 | & | bitwise and, e.g. i & mask |
| 9 | | | bitwise or, e.g. m1 | &0100 |
The lower the number, the higher the precedence of the operator. Note the syntax for subscripting and record selection. The object to which subscripting is applied must be a pointer or array name. The debugger will check both the number of subscripts and their bounds in languages which support such checking. A warning will be issued for out-of-bound array accesses. As in C, the name of an array may be used without subscripting to yield the address of the first element.
The prefix indirection operator * is used to dereference pointer values, in the same way as Pascal's postfix operator ^. Thus if ptr is a pointer type, *ptr will yield the object it points to (as ptr^ in Pascal).
To access the fields of a record through a pointer, you can either use (*recp).field, or the C 'shorthand' notation, recp->field.
If the lefthand operand of a right shift is a signed variable, then the shift will be an arithmetic one (i.e. the sign bit is preserved). If the operand is unsigned, the shift is a logical one, and zero is shifted into the most significant bit.
If incompatible types are used during expression evaluation, the debugger will print a warning message, but evaluation will continue.
Constants may be integers (to the base specified in the Base option), hex integers (preceded by &) character constants, strings or floating point numbers. The following show examples of each:
| 32768 | Integer in the currently selected base |
| &8000 | Hex integer |
| 3.2768e4 | Floating point number |
| 'A' | Character constant |
| "Hello, World" | String |
This section describes the syntax for low-level expressions. It is directed mainly at assembly language programmers. You can skip this if you will only be using the high level language debugging facilities.
The syntax for a low-level expression (as used, for example, when setting a breakpoint on a memory address or displaying a disassembly or memory dump) is as follows (an understanding of BNF is assumed):
expr ::= value + expr | value | expr
value ::='&' hex-number | number | symbol
where hex-number is a hexadecimal number, number is a number in the default base (hexadecimal if no default base specified) which must start with a digit in range 0...9 and symbol is a low level symbol in the debugging information produced by the linker.
| main | Address of function main. |
| main + &14 | Five words into main. |
| 8000 | Start of image (assuming the image has not been relocated and the default base is hex.) |
| Image$$RO$$Base | Preferred way of specifying base of program. |
This section describes how you can control the way in which the debugger executes your program.
Continue starts or restarts execution of the program. Execution continues until one of the following events occurs:
You can interrupt execution of the program at any time by pressing Shift-F12. Note that if another task is executing when you press Shift-F12 you may need to generate an event to force execution to return to the program before the Shift-F12 interrupt will be noticed. The simplest way to do this, usually, is to click on the program's icon on the icon bar, or click on one of its windows.
As the debugger sets a breakpoint on procedure main, you can usually use Continue to start execution of the program and get to the first line of your source text. You cannot do this if
Note that if you have any watchpoints set, the instructions are single stepped instead of executed and the watchpoints are checked after each instruction. If any have changed, the single stepping is stopped at that point. This will be completely transparent, except that the program runs more slowly than normal.
Single step allows you to step execution through one or more source statements or ARM instructions. Choosing Single step produces the following dialogue box:
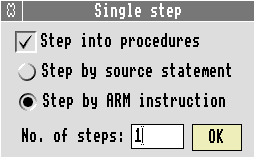
No. of steps allows you to enter the number of statements or instructions to be executed. The Step by source statement and Step by ARM instruction radio icons allow you to specify whether the contents of No. of steps should be treated as a source statement count or an ARM instruction count.
The Step into procedures option icon selects whether procedure calls should be treated as a single source statement / ARM instruction or whether single stepping should continue into the procedure call.
Note that the debugger cannot detect certain types of procedure calls, for example, calls via function variables in C. In these cases the debugger will continue stepping into the procedure, regardless of the setting of the Step into procedures option.
Note for assembly language programmers: The debugger treats BL instructions as procedure calls, so if some other instruction is used to call a procedure, this will not be detected by the debugger. For instance, consider the following example, which might be produced by the C compiler when calling via a function variable.
    MOV     lr, pc          ; Set up link. PC = current instruction + 8
    LDR     pc, [sp, #o_fn] ; Load PC from function variable on stack
    ...                     ; Returns here
You complete the Single step dialogue by clicking on OK or pressing Return. The specified number of statements or instructions are then executed.
Note that if you are currently stopped at an ARM instruction for which there is no source information, stepping one source statement will step ARM instructions until an instruction for which source information is available is reached. This can be used when you initially start a debugging session, and wish to step to the first source statement to be executed. This is usually the first instruction of main for C programs, but need not necessarily be so, if, for example, the module containing main was not compiled with debugging information.
You can use Ctrl-S as a short cut for single stepping 1 instruction or source statement. The Step into procedures and Step by source statement / Step by ARM instruction are determined by the current settings in the Single step dialogue box (i.e. the settings when the dialogue box was last displayed).
Call allows you to call a named procedure. Choosing Call produces the following dialogue box:
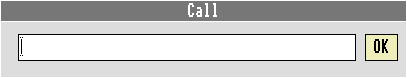
The writable icon allows you to specify the name of the procedure to be called. You can specify arguments to the procedure in a comma-separated list in round brackets after the procedure name.
The arguments must be word-sized objects (e.g. integers or pointers) or floating-point values. Floating-point arguments occupy the next two adjacent ARM registers or stack words as described in the Arm Procedure Call Standard (i.e. floating-point arguments are not passed in floating-point registers).
Complete the dialogue by clicking on OK or pressing Return. The specified procedure is called with the arguments on the program's stack, and in ARM registers R0 - R3.
Note that the program's stack pointer must be initialised before attempting to call a procedure: calling a procedure without a valid stack pointer may result in a Data abort or Address exception. Therefore, if you are debugging a program written in C, you must ensure you have executed the run-time system initialisation code using Continue or Single step as described above. If you are debugging a program written in assembler, you must ensure that you have executed your own initialisation code, which must initialise the stack pointer.
Return allows you to return from the current procedure. Choosing Return produces the following dialogue box:
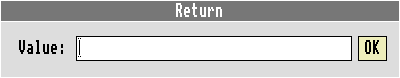
You can enter a value to be returned from the procedure in the value writable icon. This may be either an integer or floating-point value. If you do not specify a value, a default value of 0 (or 0.0 for floating-point values) is used.
Note that the Return option returns from the procedure in the current context. If you used the Context option to change the current context to an outer context on the stack n on the debugger's menu, the Return option will return from the procedure in the selected context, rather than the currently executing procedure.
Breakpoint is used to add and remove breakpoints. Choosing Breakpoint produces the following dialogue box:
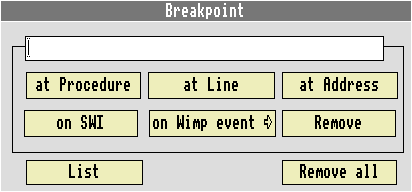
Choosing one of the at Procedure, at Line or at Address buttons sets a breakpoint at the procedure, source line number or memory address entered in the associated writable icon. The syntax for specifying these objects is described in the Specifying program objects.
Choosing the on SWI button causes the debugger to stop when the named SWI is called by the debuggee. SWI names are specified as in the RISC OS Programmers Reference Manual except that a leading 'X' is ignored and case is ignored when matching SWI names.
Choosing the on Wimp event leads to the following dialogue box:
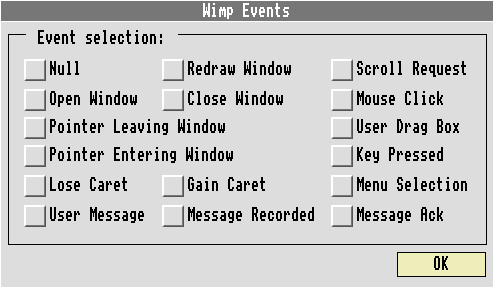
Select the set of Wimp events you are interested in and click OK. The debugger will stop execution of the debuggee when it receives one of the specified events and will display a message describing the event received.
For example:
Event = User message, action = 0 (Quit)
Choosing Remove removes the breakpoint specified in the associated writable icon. The breakpoint may be specified as a breakpoint number, as given in the list breakpoints command, preceded by a hash (#) or it may be specified exactly as specified when setting the breakpoint.
List displays a list of all currently set breakpoints with breakpoint numbers which can be used when removing individual breakpoints.
Remove all removes all current breakpoints.
You can use Ctrl-B as a short cut to produce the Breakpoint dialogue box.
Breakpoints may also be set or cleared by clicking on a line in a source or disassembly display. Clicking on a line sets a breakpoint on the line. The breakpoint is shown by the breakpoint marker (a filled in circle) to the left of the line. Clicking on a line which already has a breakpoint removes the breakpoint.
Choose Watchpoint to detect when a variable or memory location changes its value. When a watchpoint is in force, instructions in the program are single stepped instead of being executed and the values of the variables being watched are checked after each instruction or source statement executed. Watchpoints may be set on simple variables such as integers or more complex variables such as structs and arrays. Setting a watchpoint on a whole array can be very useful if, for example, you are debugging a sort routine; you can track all changes to the array as it is sorted.
Since the debugger is single stepping, execution can be quite slow, typically between 4 and 10 times as slow as normal execution. If this is too slow to be practical, the best approach is to try to isolate the section of code under suspicion, set a breakpoint on entry to this section of code, and only set the watchpoint(s) when the program stops at the breakpoint.
Choosing Watchpoint produces the following dialogue box:
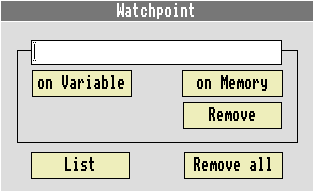
Selecting on Variable or on Memory sets a watchpoint on the variable or memory location specified in the associated writable icon. The syntax for specifying variables or memory addresses is described in the Specifying program objects.
Remove removes the watchpoint specified in the associated writable icon. As with breakpoints the watchpoint to remove may be specified as a watchpoint number preceded with a hash (#) or exactly as specified when setting the watchpoint.
List displays a list of watchpoints currently in force. Remove all removes all watchpoints.
Note that if you are watching a local variable (i.e. a variable stored on the stack) the watchpoint will become invalid on exit from the procedure containing the variable being watched. The debugger detects this and stops execution with the message:
Watchpoint watchpoint discarded on exit from procedure
where watchpoint is the name of the variable being watched.
Also note that when you are watching a variable which is stored in a register, the debugger may erroneously report a change in the variable's value. This is because the C compiler does not allocate registers to variables over the whole range of a procedure. Instead, it allocates the registers over the lifetimes of variables (i.e. the range of the procedure in which the variable is actually used). Outside this range a register may be used for other purposes (such as temporary values in calculations). It may even be allocated to another variable, if the lifetimes of the variables do not overlap. Thus the debugger may report a change in the variable when it sees the register changing, but of course the register is no longer being used to store the variable.
You can use Ctrl-W as a short cut to produce the Watchpoint dialogue box.
Trace allows you to select a set of actions about which you wish to be informed. When one of these actions occurs a message to this effect is displayed in the debugger's status window. For certain actions the source / disassembly display is updated to show where the action occurred.
The actions which you can trace are as follows:
The source / disassembly display is updated for every ARM instruction or source statement executed (ARM instruction if Machine-level debugging is enabled, source statements otherwise). The effect is to produce a continuous execution display in the context window.
When a breakpoint occurs, instead of stopping execution, a message is displayed in the Status window:
Break at breakpoint
where breakpoint is the location of the breakpoint. The source / disassembly display is updated to show where the breakpoint occurred. Execution then continues after the breakpoint.
When a watchpoint changes, a message of the following form is displayed:
Watchpoint watchpoint changed at location
where watchpoint is the name of the variable being watched, and location is the program location where the watchpoint was changed. If, for example, you are debugging a sort routine and have a watchpoint on the array being sorted, you can select watchpoint tracing to provide a continuous update of all changes to the array.
When procedure tracing is enabled, a message of the following form is displayed:
Entered procedure procedure name
This can be useful if you wish to quickly locate the procedure where a fault is occurring.
When a Wimp event break occurs execution is not halted. Instead of stopping at the breakpoint a decoded form of the event data is displayed and execution continues.
When a SWI break occurs execution is not halted, a message is displayed:
Break at SWI SWI Name
The SWI is then executed and execution continues after the SWI breakpoint.
Choosing Trace from the debugger's menu produces the following dialogue box:
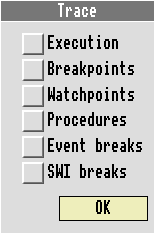
Select the set of actions you are interested in tracing and click on OK. A message confirming your selection will be displayed. You won't notice the effects of enabling procedure tracing until execution of the debuggee is resumed.
This option allows you to display information about the program being debugged. You can examine source text, instruction disassembly, variable contents, memory contents, stack backtrace information, register contents and low-level symbol values. Choosing Display produces the following dialogue box:
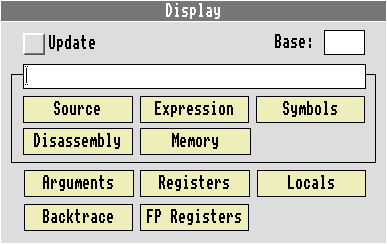
You can use Ctrl-D as a short cut to produce this display.
Select the item you want information about. The Source, Expression, Symbols, Disassembly and Memory icons use the contents of the writable icon to determine what to display. Each icon is described in turn below.
Displays the specified source file in the debugger Context window. You can specify a source line number at which to start the display. The syntax for the filename and line number is:
filename[:line]
(that is, a valid RISC OS filename optionally followed by a colon (:) and a line number). The line number defaults to 1 if not specified. The filename does not have to be a source file used to generate the program you are debugging: you can display any file you like.
The writable icon should contain an expression name. The syntax for entering expression names is described in the Specifying program objects. The expression is displayed in the debugger Status window.
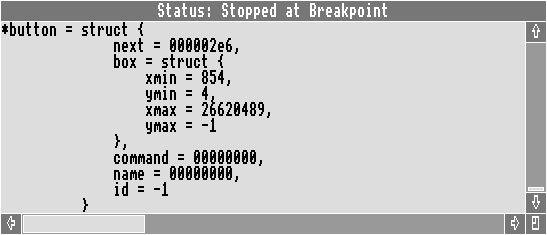
Complex expressions such as C structs or arrays are displayed in structured format, nested substructures are indented to indicated the level of nesting. Character pointers and arrays are displayed as strings if a terminating 0 is found within the first 80 characters and there are no intervening non-graphic characters apart from newline and carriage return, which are displayed as \n and \r. For example, the following structure:
typedef struct _HotSpot
{
   struct _HotSpot *next;
   BBox             box;
   char            *command;
   char            *name;
   ComponentId      id;
}
HotSpot;
HotSpot *button;
would be displayed as:
Arguments displays all the arguments to the current procedure. The arguments are displayed as if each individual argument had been displayed using the Display Expression facility described above.
If you want to examine the arguments in an outer scope (i.e. in the procedure which called this procedure or the procedure which called that ...) you can use the Context item on the main menu to change the current context to that of one of the calling procedures, and then select Arguments to display the arguments of that procedure.
Locals is very similar to Arguments. It displays all local variables (including the arguments) in the current procedure.
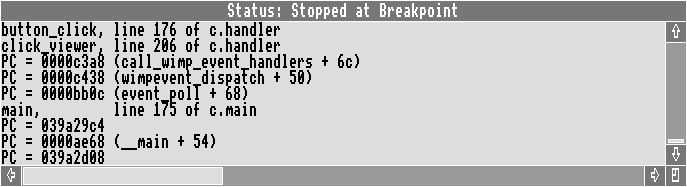
Backtrace displays a list of procedures in the call chain from the current procedure back to the program entry point.
Procedures which have been compiled with debugging information are displayed in the following form:
procedure, line line of file
Those which have been compiled or assembled without debugging information look like this:
PC = address (procedure + offset)
Procedures in the Shared C Library will appear as:
PC = address
A typical backtrace might look something like this:
Symbols displays low-level symbols generated by the linker when linking with debugging enabled. The writable icon gives a comma-separated list of symbols to be displayed. The symbols and their addresses are displayed in the debugger's Status window.
You can use the following wildcard characters in symbol names:
For example:
| _kernel_* | would list all the kernel routines (e.g. _kernel_swi) |
| *$$*$$* | would list all the linker generated symbols (e.g. Image$$RO$$Base and C$$code$$Base). |
This displays a symbolic instruction disassembly in the debugger's Context window. The writable icon should contain a low-level expression which evaluates to a memory address indicating where the disassembly should start. The syntax for low-level expressions is described in the Specifying program objects.
This displays a memory dump in the debugger's Context window. The writable icon should contain a low-level expression giving the memory address.
This displays the contents of ARM user registers 0 - 15 and the flags in R15.
This displays the contents of floating-point registers 0 - 7 and the flags in the floating-point processor status word.
The Base writable icon gives the numeric base to be used when displaying Variables, Arguments, Locals, Symbols and ARM registers. If this writable icon is left blank a default of decimal or hexadecimal is used depending on what is being displayed.
The Update box applies to Variables, Locals, Arguments, Backtrace, Registers and FP Registers. When Update is selected and one of these items is displayed, the item is added to a list of items to be displayed whenever the debugger stops execution (for example, at a breakpoint). There is no way to remove items from this list once they have been added to it.
Change allows you to alter variable, registers or memory contents. Choosing Change produces the following dialogue box:
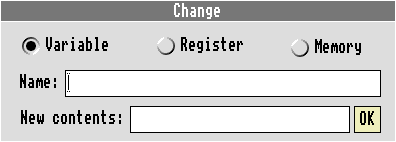
The Variable, Register and Memory radio buttons indicate what is to be changed. The Name writable icon indicates which variable, register or set of memory locations is to be changed. The New contents writable icon gives the new contents. Clicking OK makes the change.
The Name writable icon should contain a variable name as described in the Specifying program objects. Only simple variables such as integers and pointers or floating-point variables may be changed. The New Contents writable icon should contain the new value for the variable, floating-point values are specified in normal C floating-point format.
The Name writable icon should contain a register name. Valid register names are R0 - R15, SL, IP, SP, LR, PC and F0 - F7. The New Contents writable icon should contain a low-level expression or floating-point constant, depending on the type of register being changed. Low-level expressions are described in the Specifying program objects.
The Name writable icon should contain a low-level expression which evaluates to a memory address. The New Contents writable icon should contain a comma-separated list of low-level expressions, which are placed in successive memory words starting at the memory word specified in the name writable icon. The syntax for low-level expressions is described in the Specifying program objects.
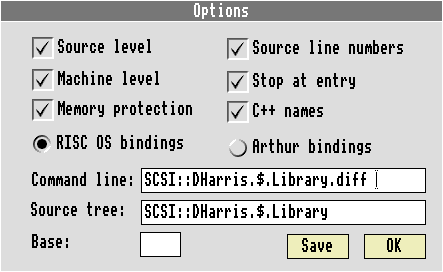
The Options item on the debugger main menu produces the following dialogue box:
This option enables the display of source information in the debugger Context window. If this option is deselected, a disassembly of the ARM instructions corresponding to the source text will be displayed.
This option enables the tracing of ARM instructions when trace execution is selected.
This option enables or disables protection of sensitive areas of memory. When this option is enabled zero page (0 - &7fff) is protected against being written to by the debugee and the debuggee's code area is protected against writing.
This option enables or disables the display of line numbers in source text displays.
When this option is enabled, the debugger automatically tries to set a breakpoint on procedure main when a debugging session is started. This allows you to use Continue on the debugger main menu to get rapidly to the start of your source code.
This option is provided for backward compatibility.
This writable icon allows you to change the command line passed to the debuggee. The existing command line is displayed in the icon and may be edited. Note that the first word of the command line should be the program name.
The Base writable icon gives the default numeric base when displaying or entering numbers.
Compilers such as Acorn's ANSI C may put relative filenames in the debugging information (e.g. c.display or ^.mip.c.aetree). The debugger needs to know where these files can be found. By default it assumes the source files reside in the directory from which the program image was loaded. This writable icon allows you to change this default. It accepts a comma-separated list of directory names, each one ending in a full stop (immediately before the comma).
This could be used when debugging a library whose source is held in a directory different to that of the debugee program source.
Log allows you to record any information output to the debugger Status window to a text file. Choosing Log produces the following dialogue box:
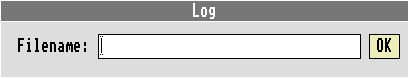
Enter the name of the file into which you wish to log output. The file will be opened as a new log file. Any previous contents of the log file will be overwritten. If a log file was previously open it will be closed when the new log file is opened.
Find allows you to find a sequence of bytes, words or characters in the application workspace. Choosing Find produces the following dialogue box:
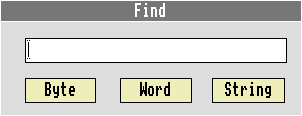
The writable icon should contain a comma separated list of low-level expressions giving the word or byte values to be found.
The writable icon should contain the sequence of characters to be found, the sequence should be entered without quotation marks of any kind.
All occurrences of the byte, word or character sequence in the application space are reported in the debugger Status window.
*Commands allows you to access the RISC OS CLI from within the debugger. Choosing *Commands will lead to the following dialogue box:
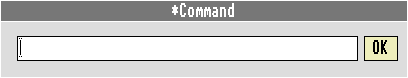
Enter the command you wish to execute in the dialogue box and press Return or click OK. If you are debugging a Wimp task (i.e. a task which has called Wimp_Initialise) you should precede the command with the WimpTask command, otherwise the output of any command executed may be displayed in graphics mode.
If you wish to enter several commands you can enter the Gos command or the ShellCLI command in the dialogue box.
Help gives interactive help on the debugger. Choosing Help will produce this initial help window:
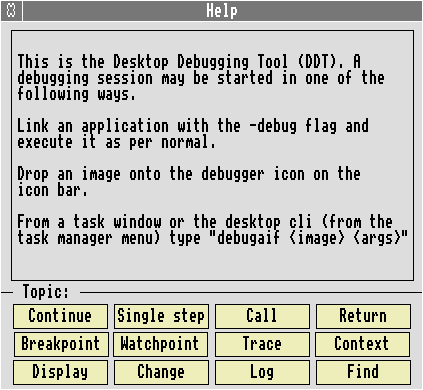
Choose the icon corresponding to the topic on which you want help. The help will be displayed in the Help box above the topic buttons.
This quits the debugger and returns to the calling environment (generally the RISC OS desktop).
The following example debugging session shows how DDT might be used to fix a rather bug-ridden file sorting tool written in C. The source is given here with line numbers for reference later in the chapter. The source, along with the other files to make the application, can be found in !Sort, which is in the AcornC_C++.Examples directory.
   1 #include <stdio.h>
   2 #include <stdlib.h>
   3 #include <string.h>
   4 #include <stdarg.h>
   5
   6 #include "kernel.h"
   7
   8 #define READATTR 5
   9 #define READFILE 16
  10 #define WRITEFILE 0
  11
  12 #define FILEFOUND 1
  13
  14 static void fail(char *errmsg, ...)
  15 {
  16     va_list ap;
  17
  18     va_start(ap, errmsg);
  19     vfprintf(stderr, errmsg, ap);
  20     va_end(ap);
  21     exit(1);
  22 }
  23
  24 /* See Sedgewick: Algorithms 2nd edition P 108 */
  25 static void sortstrings(char *a[], int n)
  26 {
  27     int h, i, j;
  28     char *v;
  29
  30     h = 1;
  31     do
  32         h = h * 3 + 1;
  33     while (h <= n);
  34     do {
  35         h = h / 3;
  36         for (i = h + 1; i <= n; i++) {
  37             v = a[i];
  38             j = i;
  39             while (j > h && strcmp(a[j-h], v) > 0) {
  40                 a[j] = a[j-h];
  41                 j -= h;
  42             }
  43             a[j] = v;
  44         }
  45     } while (h > 1);
  46 }
  47
  48 void sortfile(char *infile, char *outfile)
  49 {
  50     _kernel_osfile_block finfo;
  51     int size;
  52     char *finbuff, *foutbuff;
  53     char *cp;
  54     int l, linestart;
  55     char **lbuff;
  56     int i;
  57
  58     if (_kernel_osfile(READATTR, infile, &finfo) != FILEFOUND)
  59         fail("Error opening %s\n", infile);
  60     size = finfo.start;
  61     if (!(finbuff = malloc(size + 1)) || !(foutbuff = malloc(size + 1)))
  62         fail("Out of memory\n");
  63     finfo.load = (int) finbuff;
  64     finfo.exec = 0;
  65     if (_kernel_osfile(READFILE, infile, &finfo) < 0)
  66         fail("Error reading %s\n", infile);
  67     l = 0;
  68     cp = finbuff;
  69     linestart = 1;
  70     for (i = 0; i < size; i++) {
  71         if (linestart) {
  72             l++;
  73             linestart = 0;
  74         }
  75         if (!*cp || *cp == '\n') {
  76             *cp = 0;
  77             linestart = 1;
  78         }
  79         cp++;
  80     }
  81     *(finbuff + size) = 0;
  82     if (!(lbuff = malloc(l * sizeof(char *))))
  83         fail("Out of memory\n");
  84     cp = finbuff;
  85     for (i = 0; i < l; i++) {
  86         lbuff[i] = cp;
  87         cp += strlen(cp);
  88     }
  89     sortstrings(lbuff, l);
  90     cp = foutbuff;
  91     for (i = 0; i < l; i++) {
  92         strcpy(cp, lbuff[i]);
  93         cp += strlen(cp);
  94         *cp++ = '\n';
  95     }
  96     finfo.start = (int) foutbuff;
  97     finfo.end = (int) foutbuff + size;
  98     if (_kernel_osfile(WRITEFILE, outfile, &finfo) < 0)
  99         fail("Error writing %s\n", outfile);
 100     free(finbuff);
 101     free(foutbuff);
 102     free(lbuff);
 103 }
 104
 105 int main(int argc, char *argv[])
 106 {
 107     if (argc != 3)
 108         fail("Usage: Sort <infile> <outfile>");
 109     sortfile(argv[1], argv[2]);
 110     return 0;
 111 }
Follow the steps below to debug the example program.
Now try running the program:
This should sort the input file and display a Save as dialogue box, to allow you to save the sorted result. Unfortunately it doesn't, instead it produces a display similar to the following:
Illegal address (e.g. wildly outside array bounds)

Postmortem requested
  Arg2: 0x0000000c 12 -> [0xe59ff110 0xe59ff110 0xe59ff110 0xeae00ce7]
  Arg1: 0x0000ca8c 51852 -> [0x0000cb14 0x0000cb18 0x0000cb18 0x0000cb18]
3984074 in function sortstrings
  Arg2: 0x0000ad70 44400 -> [0x49534353 0x48443a3a 0x69727261 0x2e242e73]
  Arg1: 0x0000ad3f 44351
8348 in function sortfile
  Arg2: 0x0000acf4 44276 -> [0x0000ad10 0x0000ad3f 0x0000ad70 0x00000000]
  Arg1: 0x00000003 3
8430 in function main
39a29c4 in unknown procedure
84b8 in anonymous function
This is called a symbolic backtrace.
The first line gives a general indication of what might be wrong with your program. In this case it's an illegal address; the program tried to access memory which is outside the addressing range of your computer.
Each line of the form address in function name represents a procedure call frame on the stack. The first frame on the stack is function sortstrings; this is where the illegal address was referenced.
This doesn't look too promising, so try running it under DDT to get more clues as to what might be wrong:
The program actually crashed in the function sortstrings. Since you want the program to stop before making the illegal access, you want it to stop at the beginning of function sortstrings. So:
Bring up the breakpoint dialogue box. Enter the name sortstrings, and choose at Procedure.
As a general rule this is the best way to start a debugging session. By placing a breakpoint just before the section of code you think is wrong (or after the code you know to be correct) you can examine the program state to ensure it is correct and the step through the incorrect code to find exactly where the error is occurring.
Tell DDT to start executing your program:
Break at main, line 107 of c.sort
The debugger always stops on entry to main. However you want it to continue until it reaches sortstrings, so:
This time the debugger displays the following message:
Break at sortstrings, line 30 of c.sort
The Source window should contain the source for the start of function sortstrings, with the execution location indicator (=>) pointing to the first source line of the function sortstrings.
Now you want to examine the program state to ensure it is correct before continuing. In this case, the most important state information is the function's arguments. You can examine them as follows:
The debugger will display the following in the Status window:
a = 0000ca8c
n = 12
The two arguments to sortstrings are:
| n | is the number of strings to sort, in this case 12. This is correct, since there were 12 names in the input file. |
| a | is a pointer to an array of char *s or strings. The debugger displays the value of this pointer, i.e. the address of the array. |
Note: You may get a different address when you try running this example depending on the version of the C compiler and library you are using.
Next, examine the individual elements of the array:
To examine element 0, enter a[0]. To examine element 1, enter a[1]. The debugger will display the array elements as follows:
a[0] = string "Noel"
a[1] = 0000cb18
The first element was correct: it contained the string Noel, which is the first name in the input file. However, the second element is a null string. This is wrong: it should contain the string Edward. This means that the arguments to sortstrings were wrong. The error therefore occurred earlier, so you want to try re-running the program under the debugger and setting the breakpoint earlier:
The variable lbuff is passed as the first argument (a) to sortstrings. lbuff is initialised in the loop just before the call to sortstrings. Therefore you want to set a breakpoint at the start of the initialisation loop:
From the line numbers in the Source display you can see that the initialisation loop starts at line 84, with the initialisation of cp. So, set a breakpoint on line 84:
The program will continue executing until it reaches line 84, where it will stop at the breakpoint. You want to examine each element of the array as it is initialised, since the array is initialised from the pointer cp. Set a watchpoint on cp:
Watchpoint on cp changed at sortfile, line 85 of c.sort
New contents: string "Noel"
This is correct, so:
Watchpoint on cp changed at sortfile, line 87 of c.sort
New contents: 0000cb18
This is wrong: it should contain the string Edward. Look at the line which updated the value of cp:
87 cp += strlen(cp);
This is supposed to update cp to point to the next string in the list of strings to be sorted. It does this by adding the size of the string pointed to by cp into cp. Unfortunately, it miscalculates the size of the string by omitting to take into account the 0 byte at the end of the string. This means that the second and all subsequent strings are treated as null strings, because they are pointing to the 0 byte at the end of the previous string instead of the start of the string.
To fix this:
87 cp += strlen(cp) + 1;
Now try re-running the program:
The result is the same as when you first tried running it: you get the same exception, although this time trapped by DDT rather than generating a backtrace, so obviously the fix applied to line 87 didn't fix the problem. So, try running it under the debugger again:
The debugger will stop when it reaches main.
Examine the arguments. All being well they should look something like this:
a = 0000ca90
n = 12
Do the same for a[1] and a[11]. The display should look like this:
a[0] = string "Noel"
a[1] = string "Edward"
a[11] = string "Martin"
They're correct now, so something must be wrong with the sort algorithm. So, try setting a breakpoint on the inner while loop:
Break at sortstrings, line 39 of c.sort
Examine a few variables:
j = 5
h = 4
These are both correct, so look at the contents of a[j-h]:
a[1] = string "Edward"
The shellsort algorithm should be comparing against the first string (i.e. Noel). It is not, so this is wrong. Looking closely at the algorithm you can see that it has been written assuming array indices start at 1, whereas in C they start at 0.
To fix this, you could subtract 1 from each array index. However you just want a quick fix to see if it works, so:
30 a--; /* Quick hack to make array 1 origin */
All being well, the program should run to completion and produce a Save as dialogue box for the output. You can just click the OK button to save it, or you may like to drag it to the editor icon to load it into the editor to check that it has been sorted correctly.